Conversion rate up from 0.91% to 1.19% since the redesign
- Client
- Coddy
- Sector
- E-commerce, outdoor city escape games
- Services
- E-commerce CRO, UX/UI redesign, Conversion analysis
- Date
Results
+31%
conversion rate since the redesign
- Conversion rate up from 0.91% to 1.19% (1 September to 27 October, 2026 vs 2025)
- +56% revenue over the same period, with prices unchanged
- +51% paid bookings
- Prices and terms shown from the home page and on every game page
Coddy sells outdoor escape games, played around town on a smartphone, in 9 countries. The new version of the site has been live since 1 September 2026. Over the first two months, the conversion rate rose from 0.91% to 1.19%, with no change to prices.
- Company: Coddy.
- Starting point: an average conversion rate of 0.91% over September and October 2025.
- Result: 1.19% over the same period in 2026, and 406 paid bookings against 268.
The results at a glance
- +31%: conversion rate (0.91% → 1.19%)
- +51%: paid bookings (268 → 406)
- +56%: net revenue
The journey to convert
The visitor picks a city, compares the games, pays online and receives their code by email. They then play on whatever day and at whatever time suits them. The redesign reworked each of these steps, from the home page to the basket.
The changes, step by step
The home page presents the game, who it’s for and its price
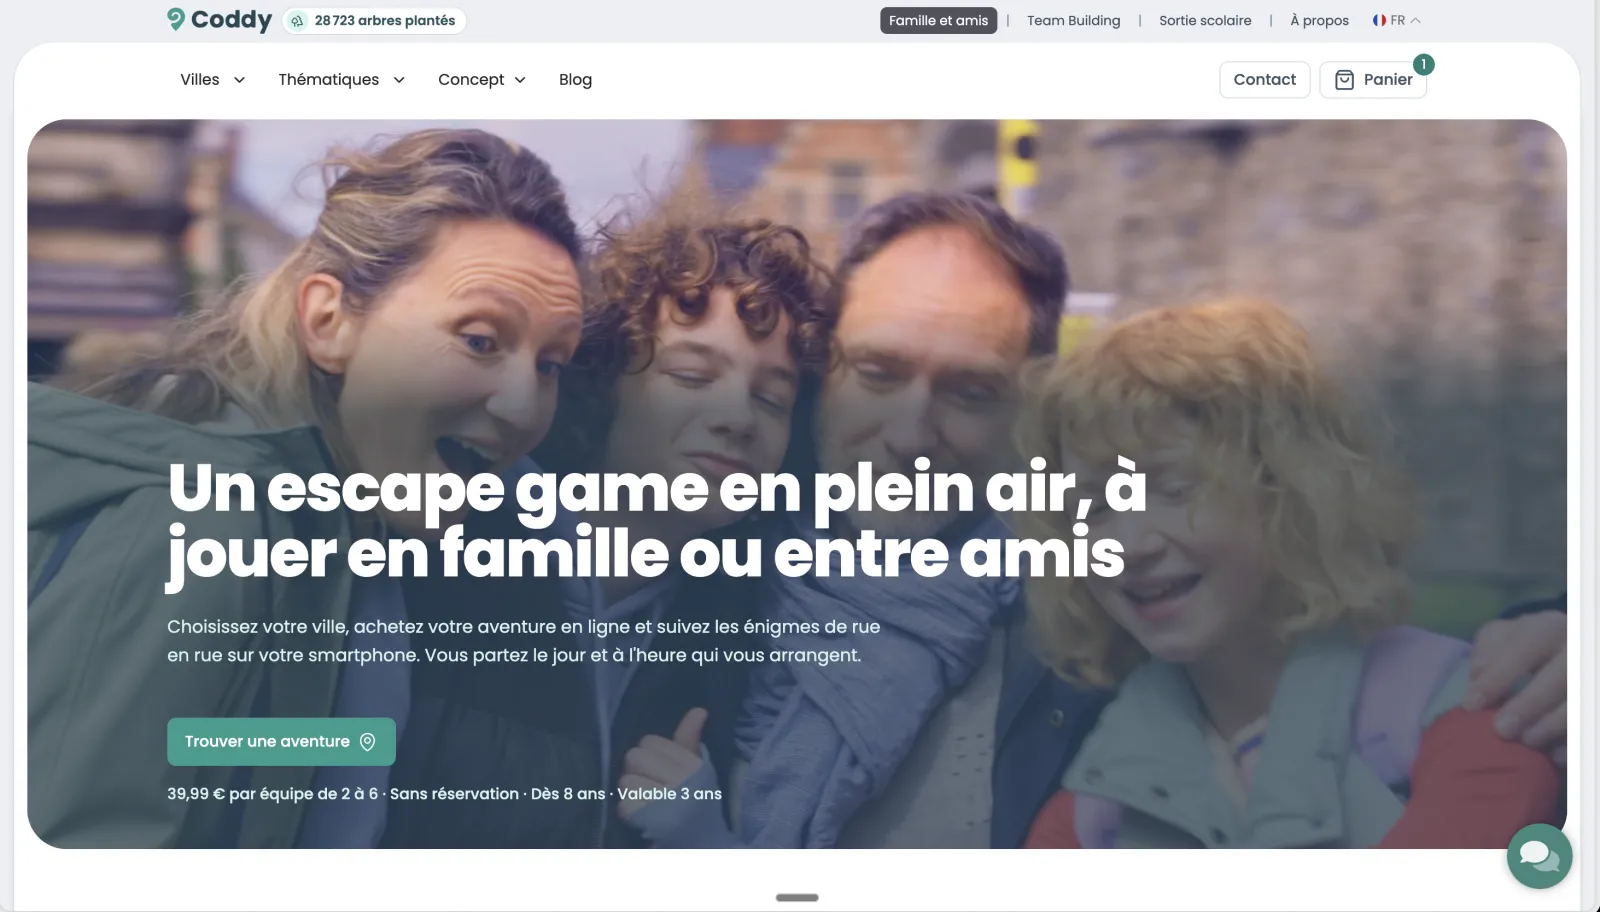
The old home page’s headline read “Explore the city and uncover its mysteries!”. The new one names the product: “An outdoor escape game to play with family or friends”.
Below the single button, “Find an adventure”, a line gives the price per team, the team size, the minimum age and how long the game stays valid, with the words “No booking needed”. The old version had two buttons side by side, “Test demo” and “Find an Adventure”. At the top of the page, visitors choose their audience: Family and friends, Team building or School trip.
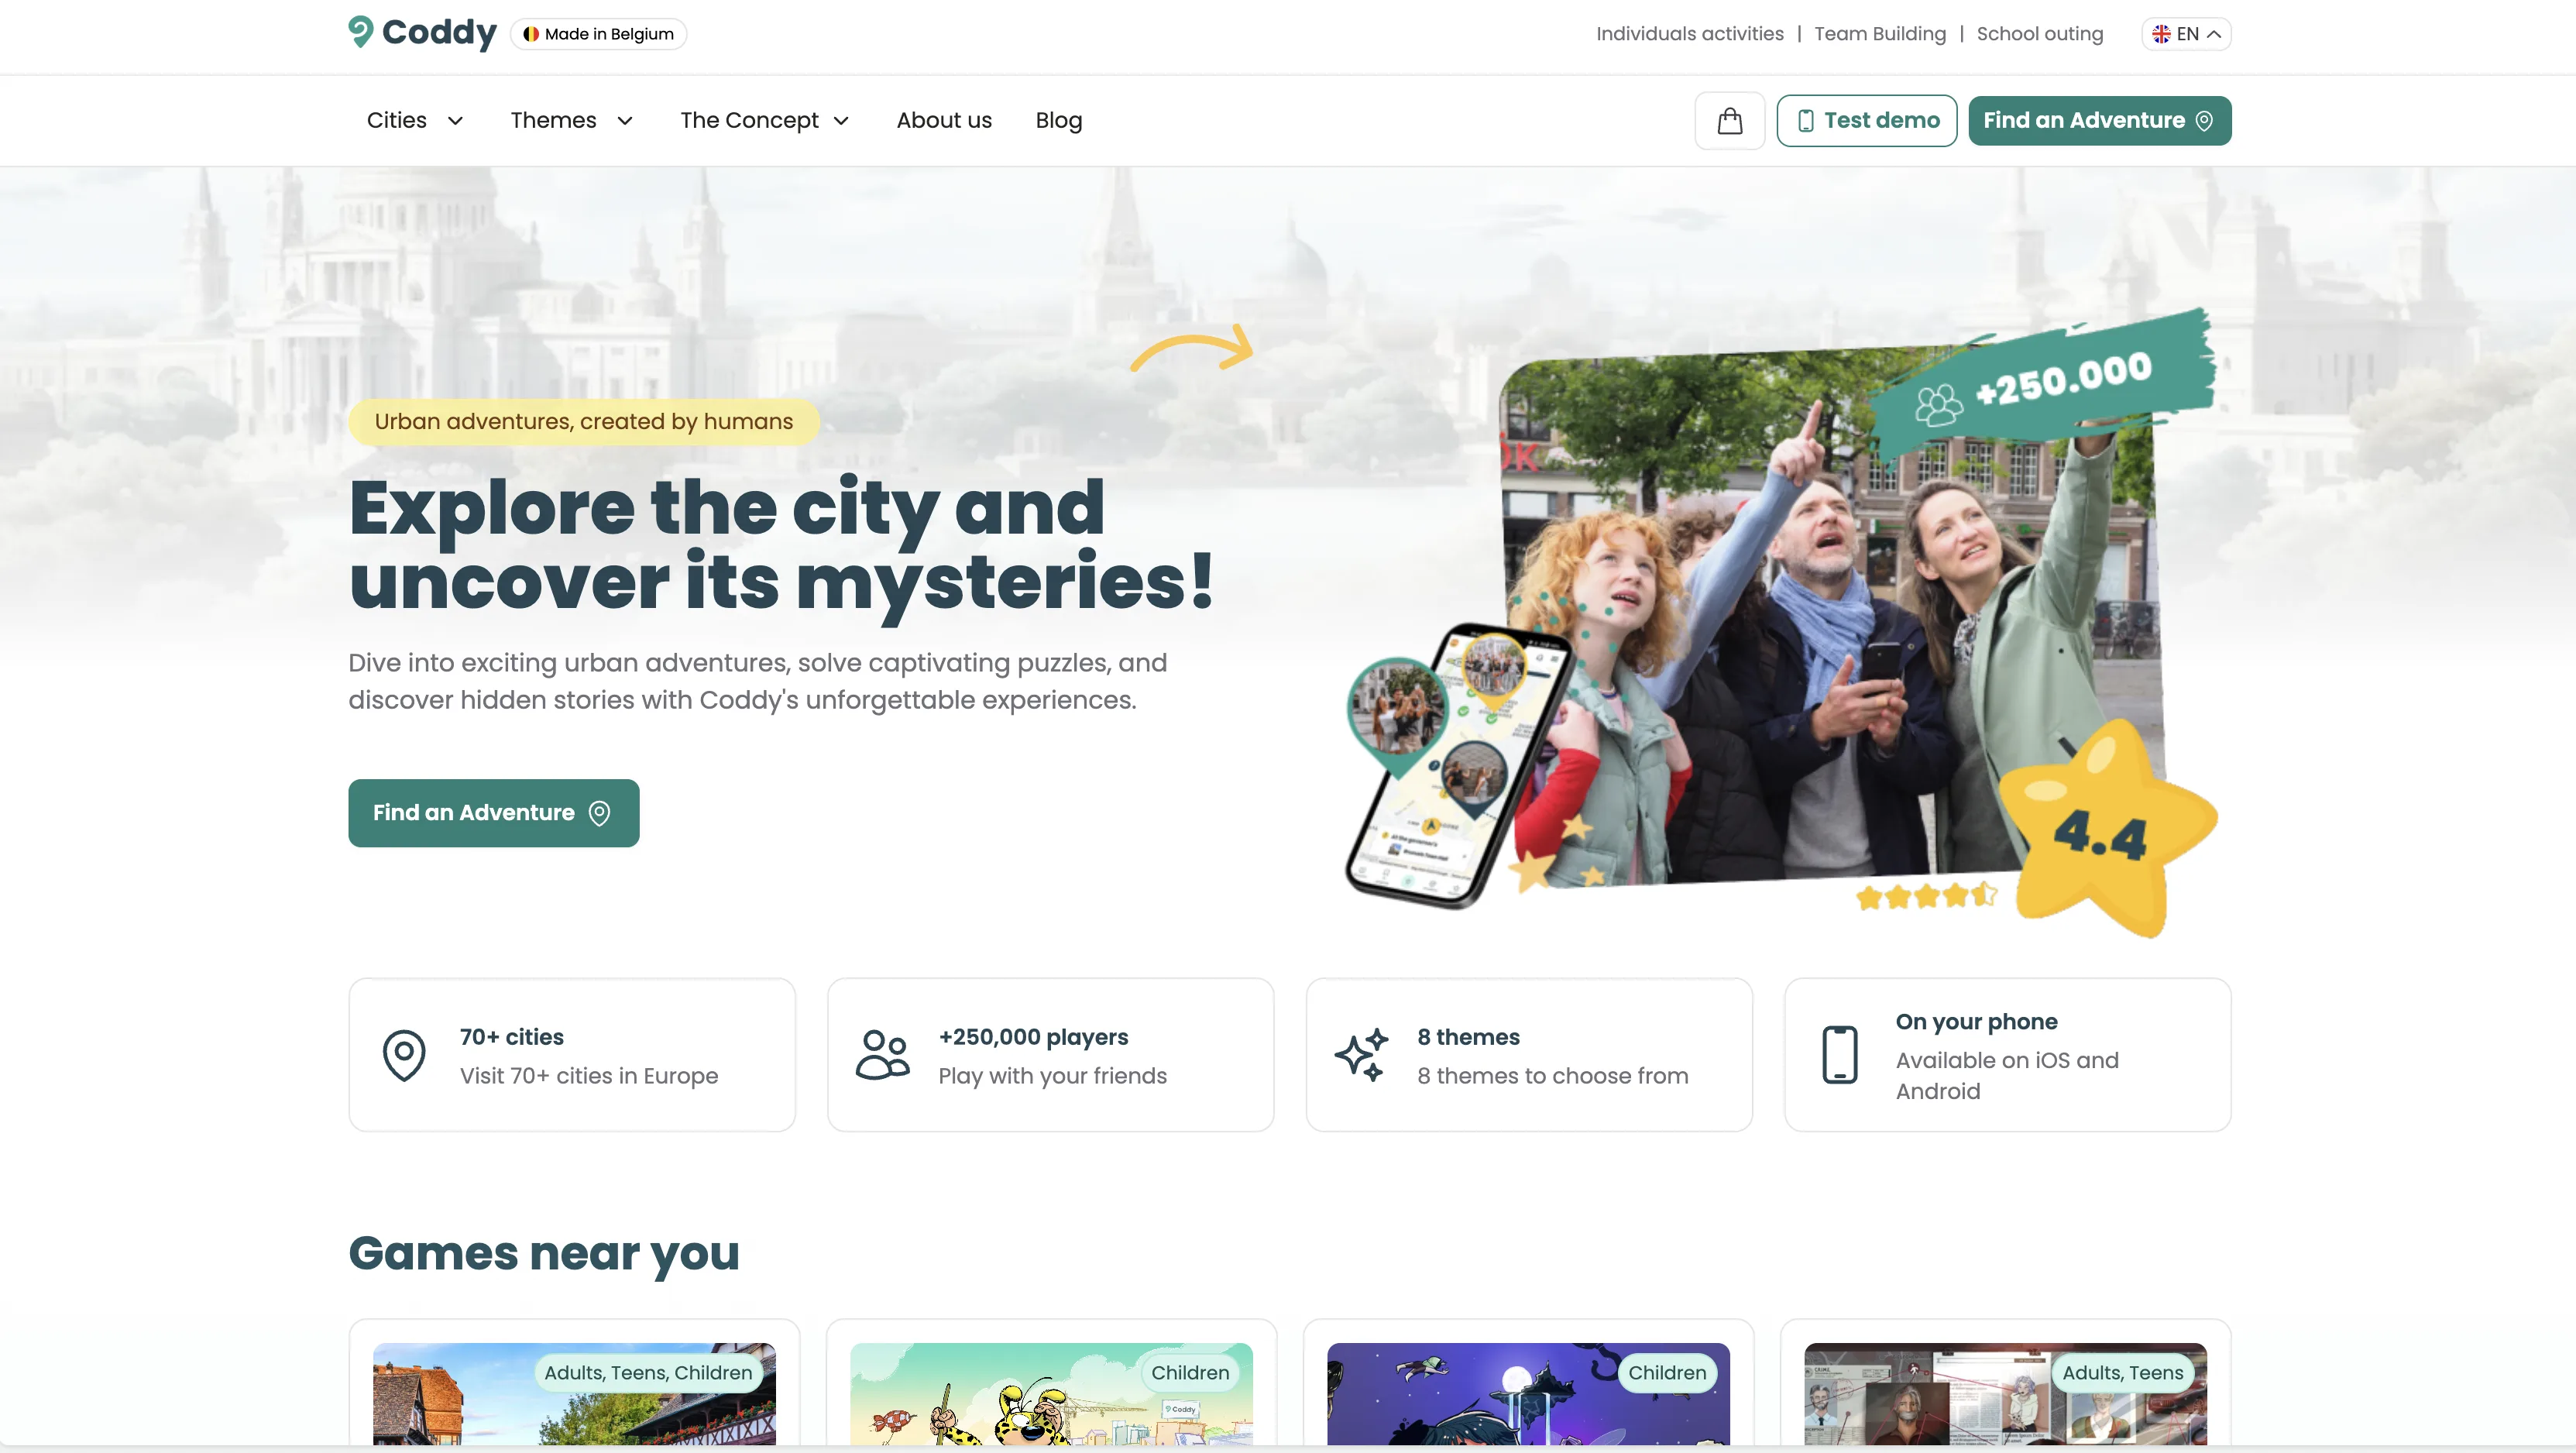
Before: a generic headline, two buttons, no price.
After: the product, the audience and the price, visible without scrolling.
Choosing a route in a city
Visitors used to go through a list of routes that repeated duplicate, barely relevant content. A city page now shows a map of the starting points and a “Who’s playing?” filter (adults, teens, children). Each game shows its duration, distance, rating, languages and price, along with its start and finish points.
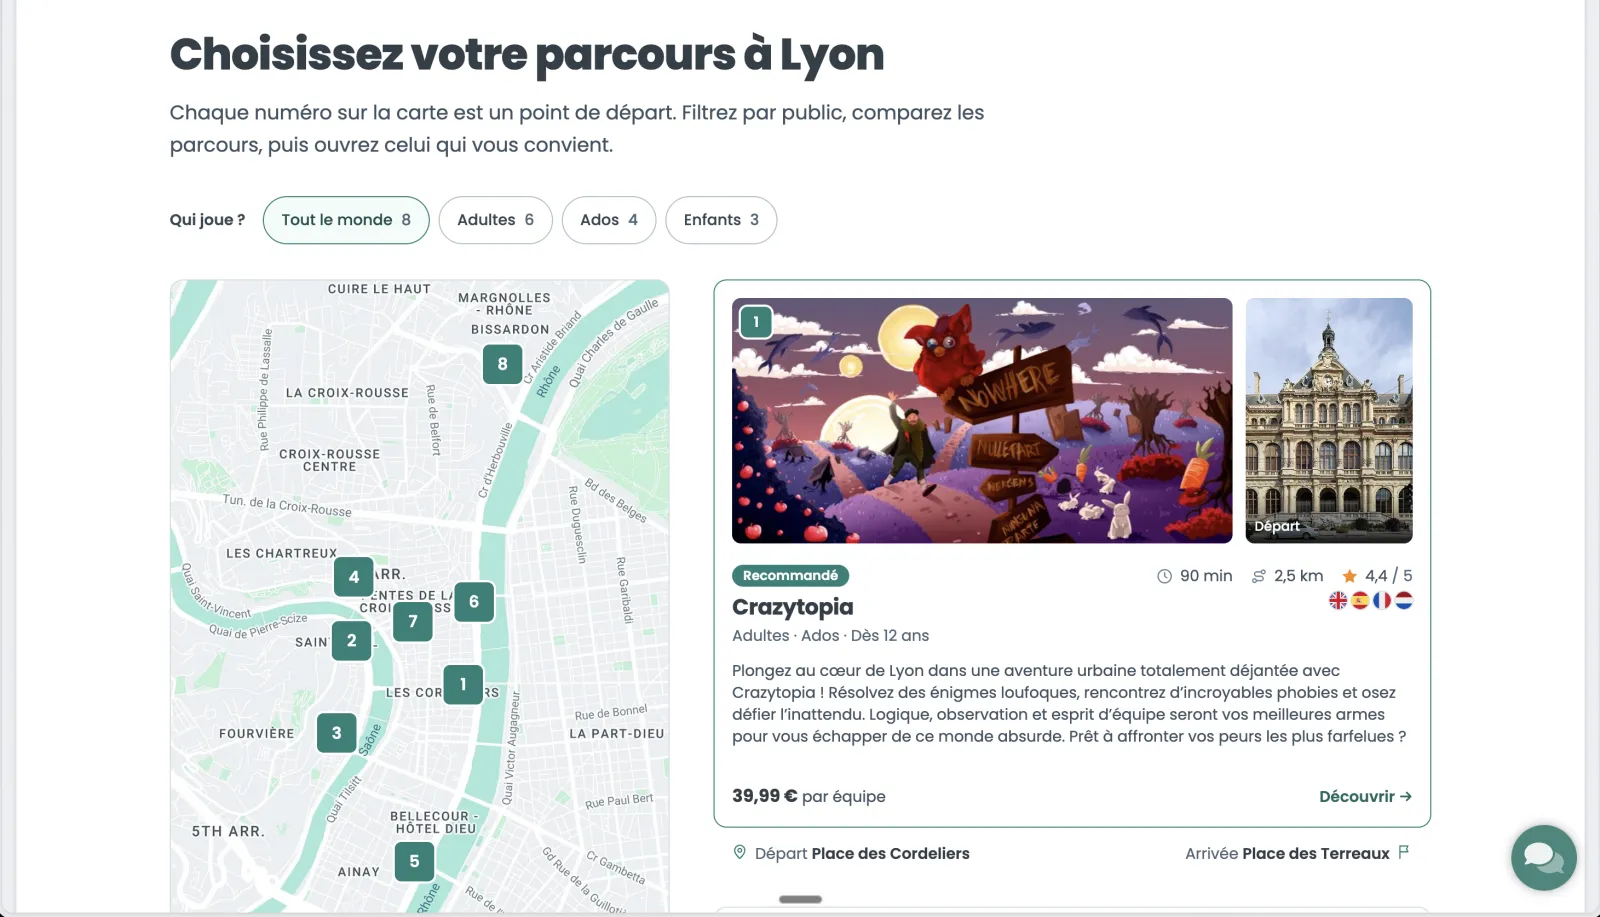
After: the city’s games compared on a single page.
The game page shows the price and the buy button straight away
The first screen of the old game page showed the game’s title, rating and poster. The new page puts a purchase box next to the title: the price per team, the price per player, a choice of number of players, the “Add to basket” button, free cancellation, the 3-year validity and the payment methods.
As visitors scroll, a bar with the price, the rating and the “Book” button stays in view. The route map gives the distance and the number of places along the way.
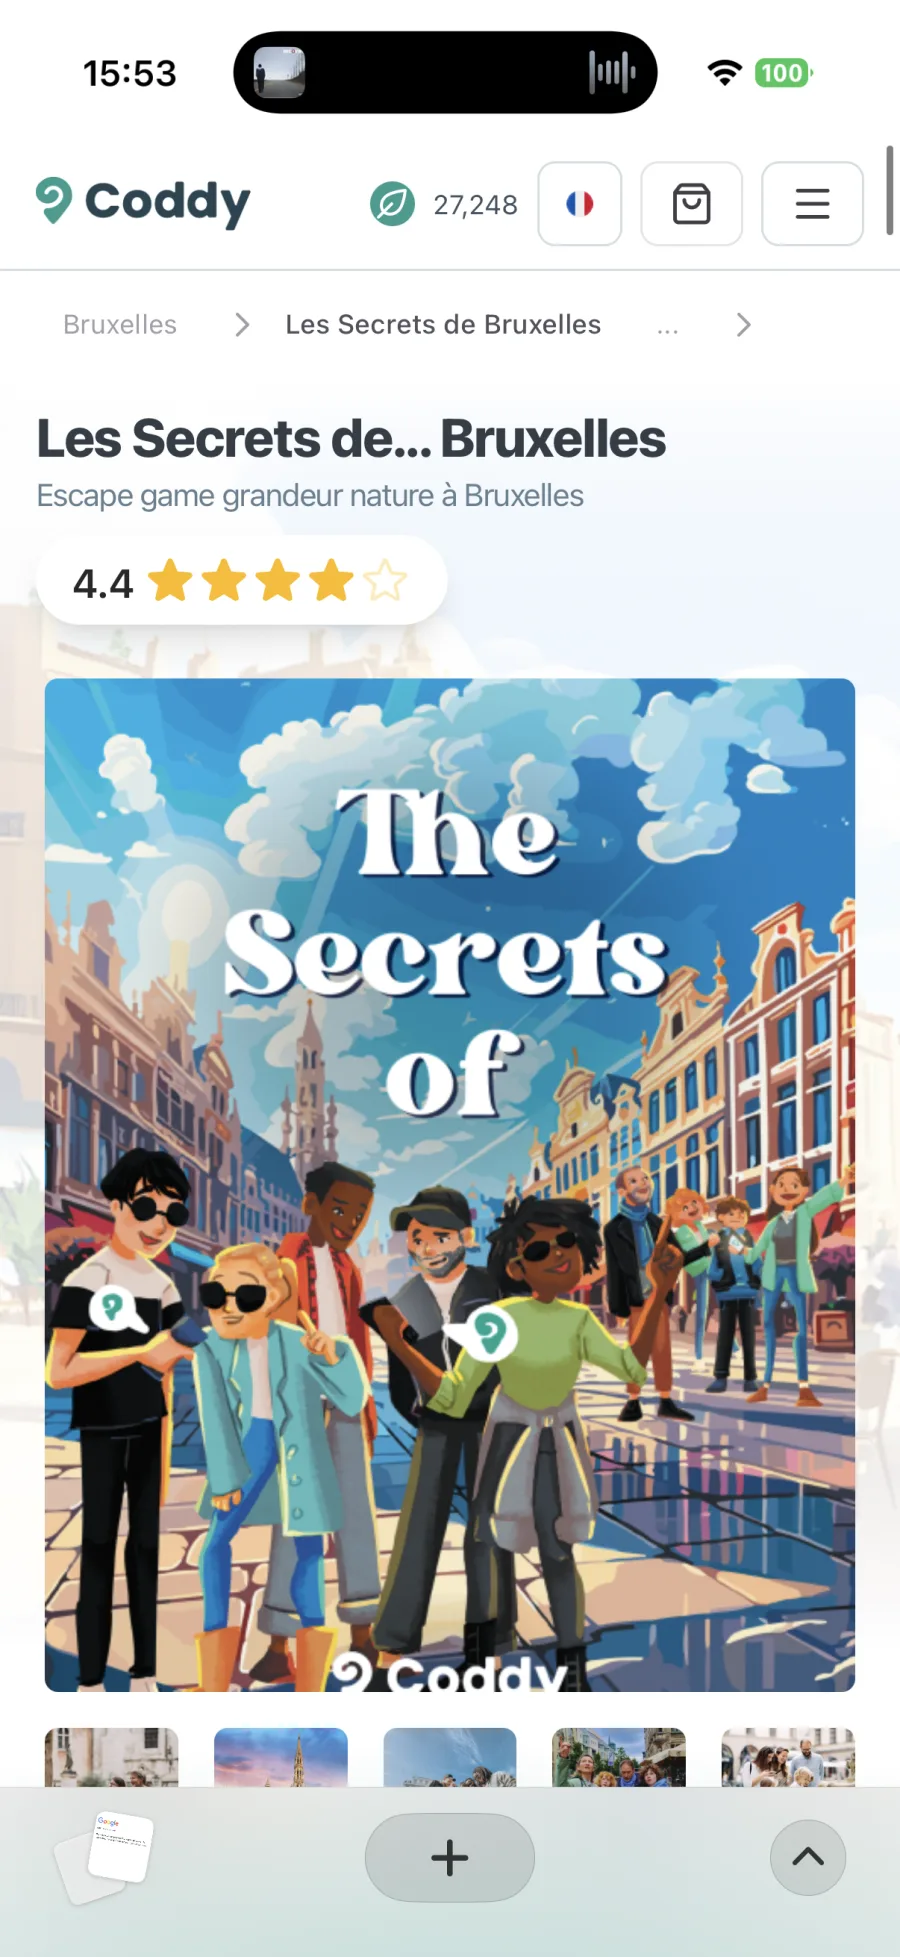
Before: the title, the rating and the poster.
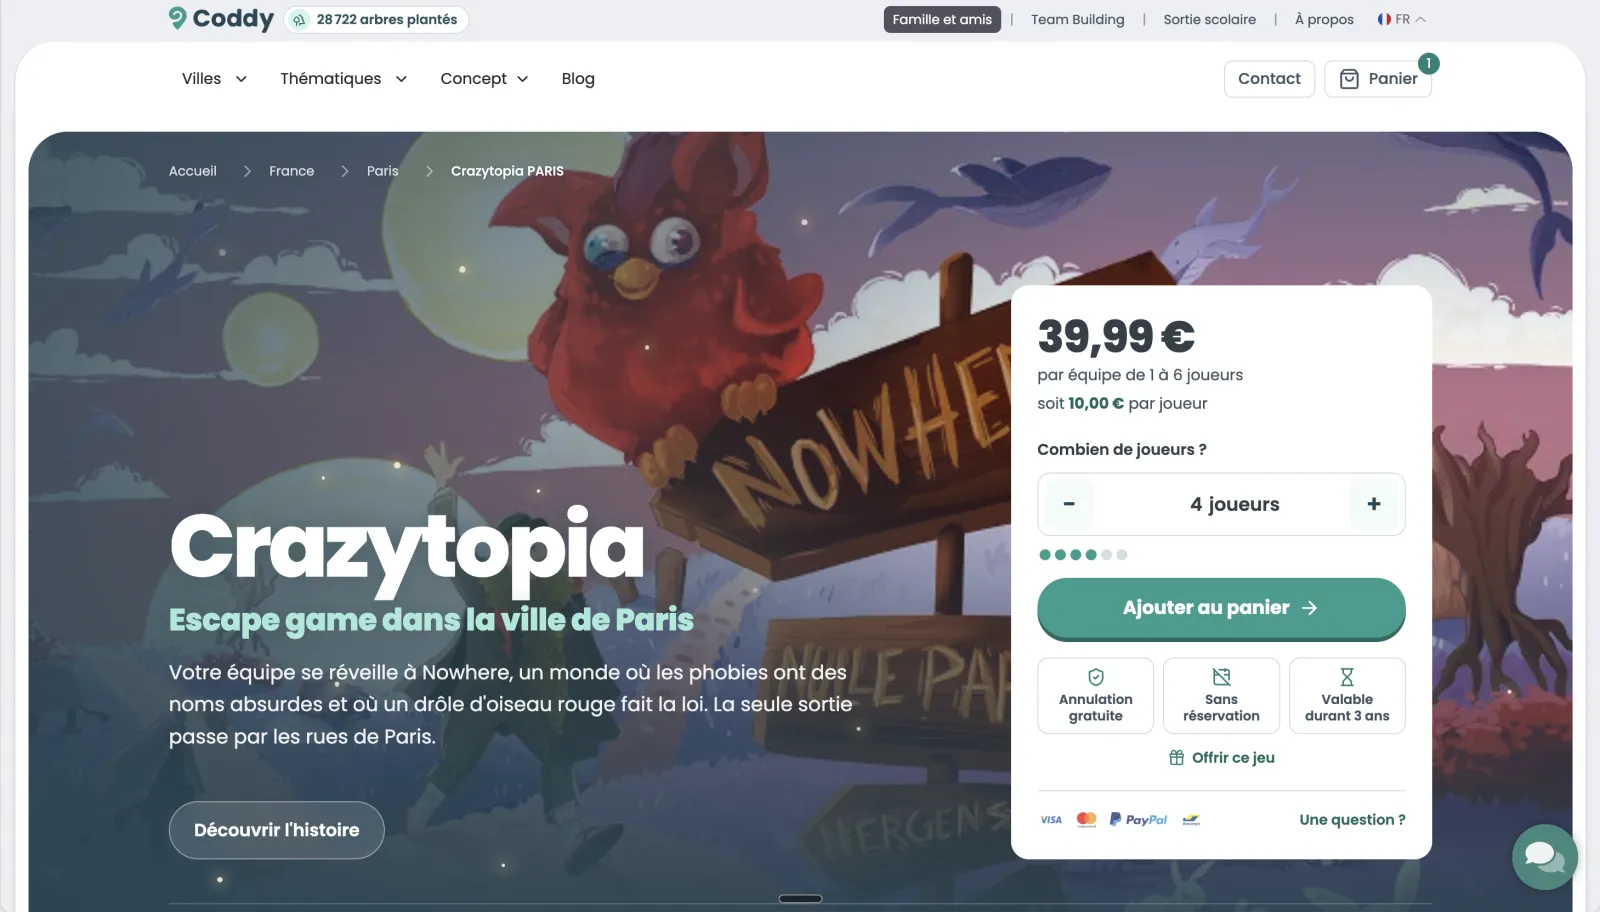
After: the price and the buy button on the first screen.
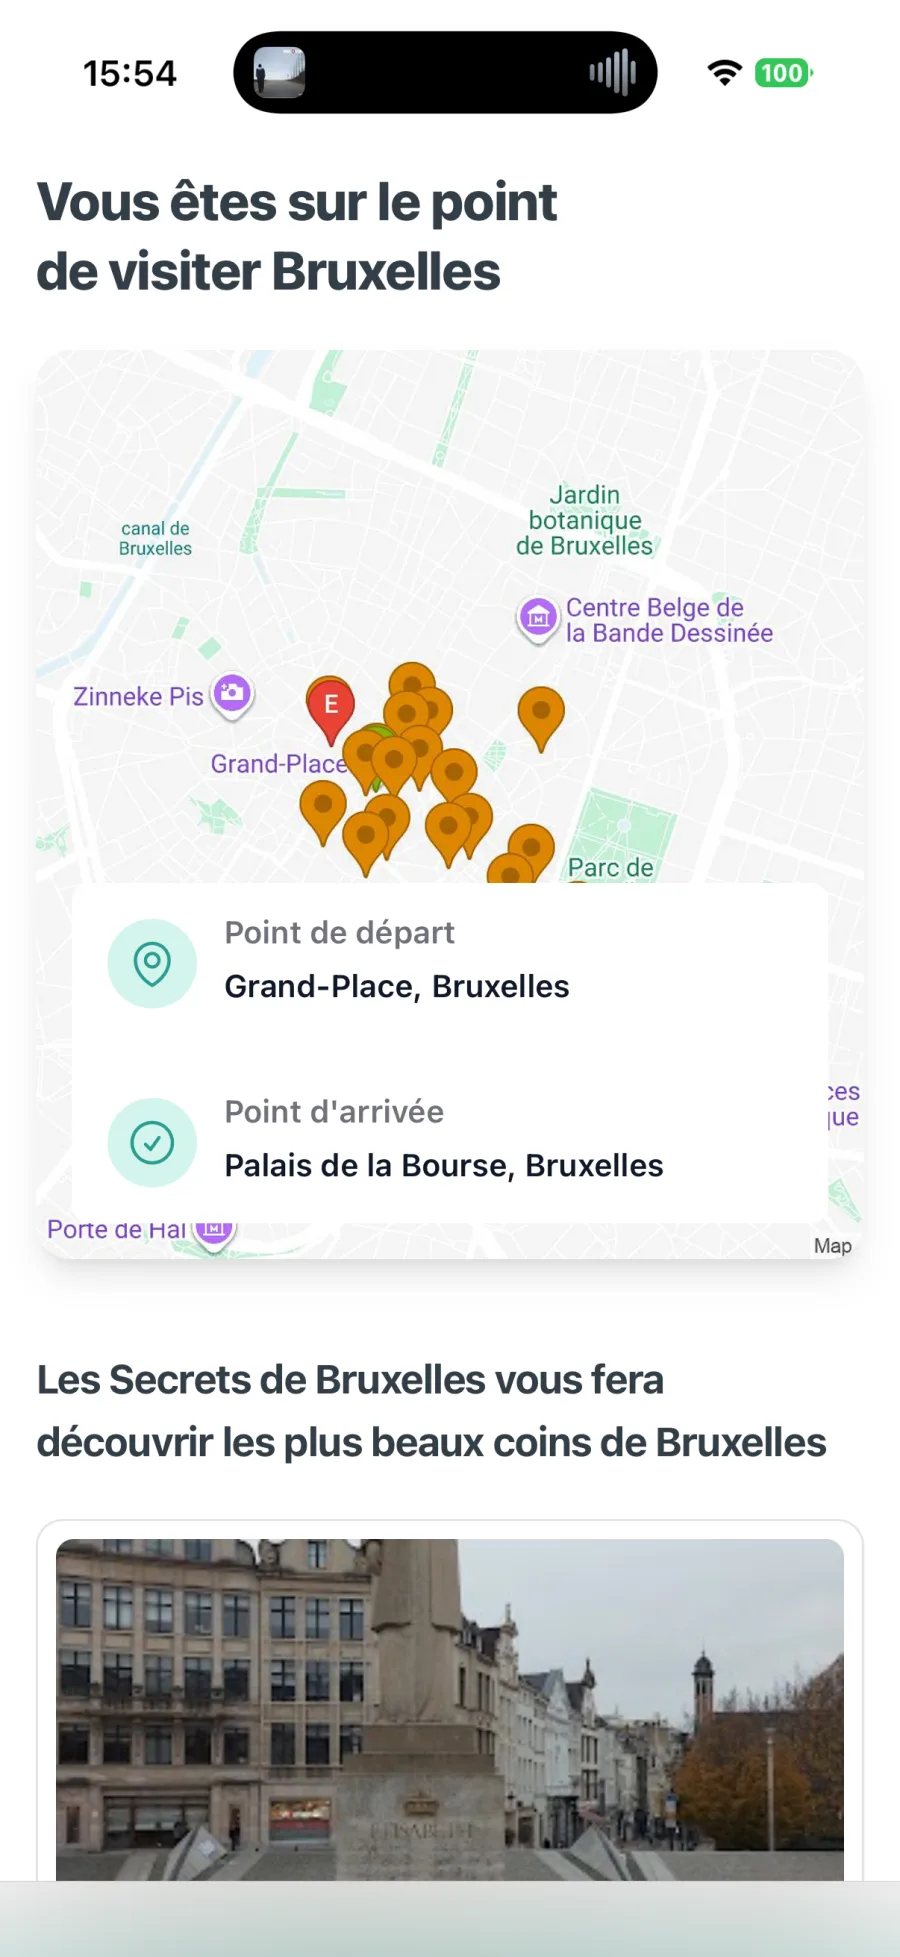
Before: a map with the start and the finish.
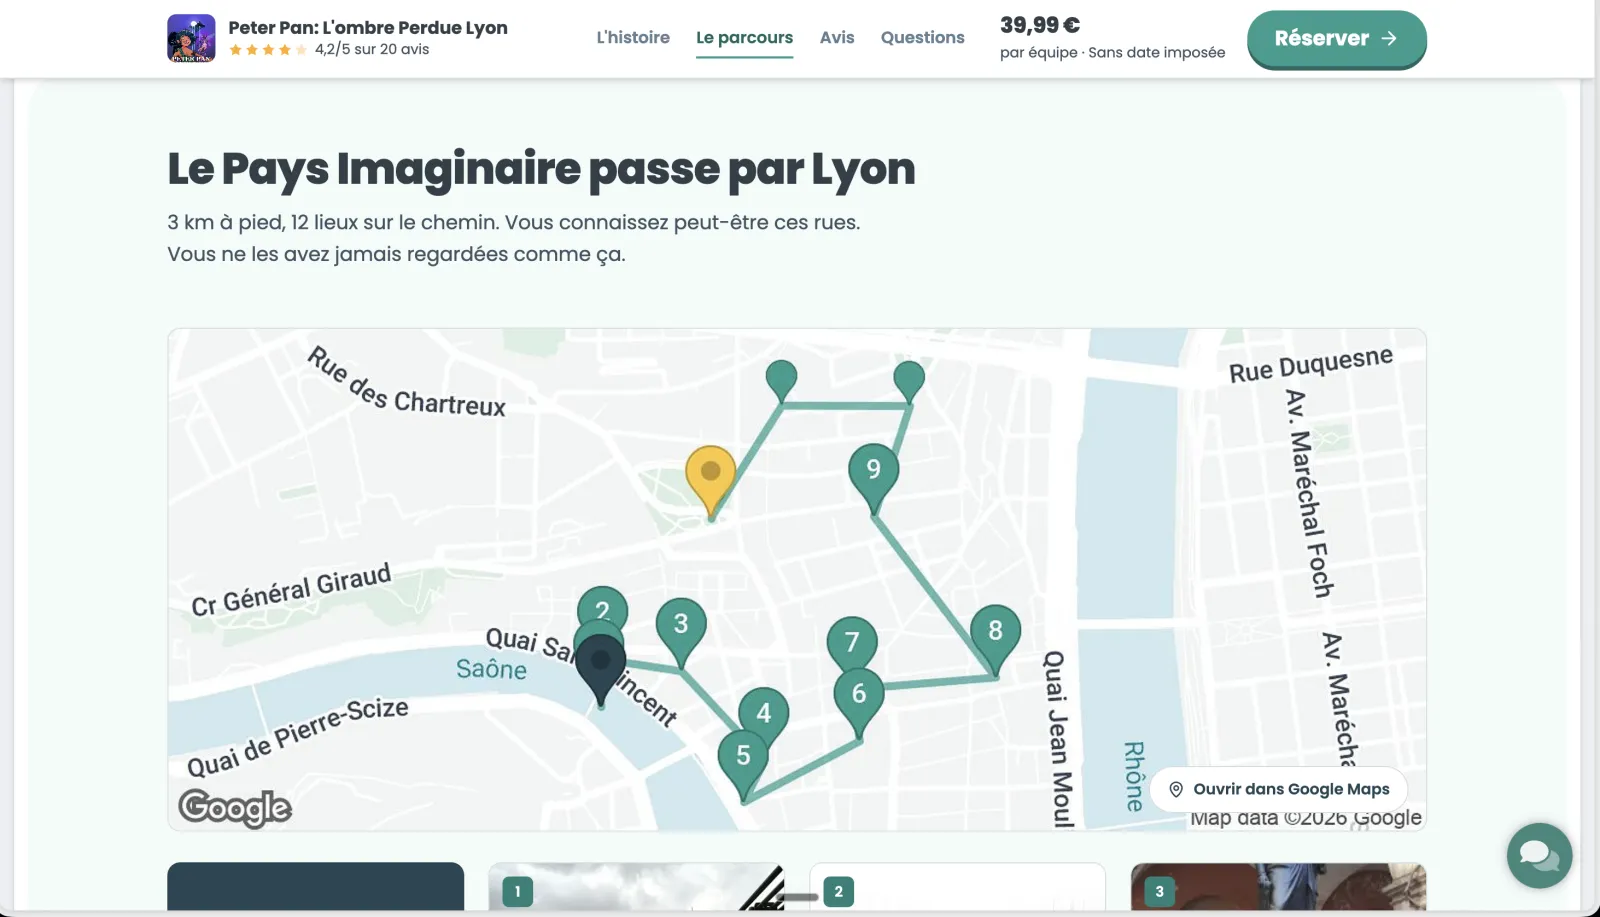
After: numbered stages, the distance, and the “Book” button always visible.
A new checkout flow
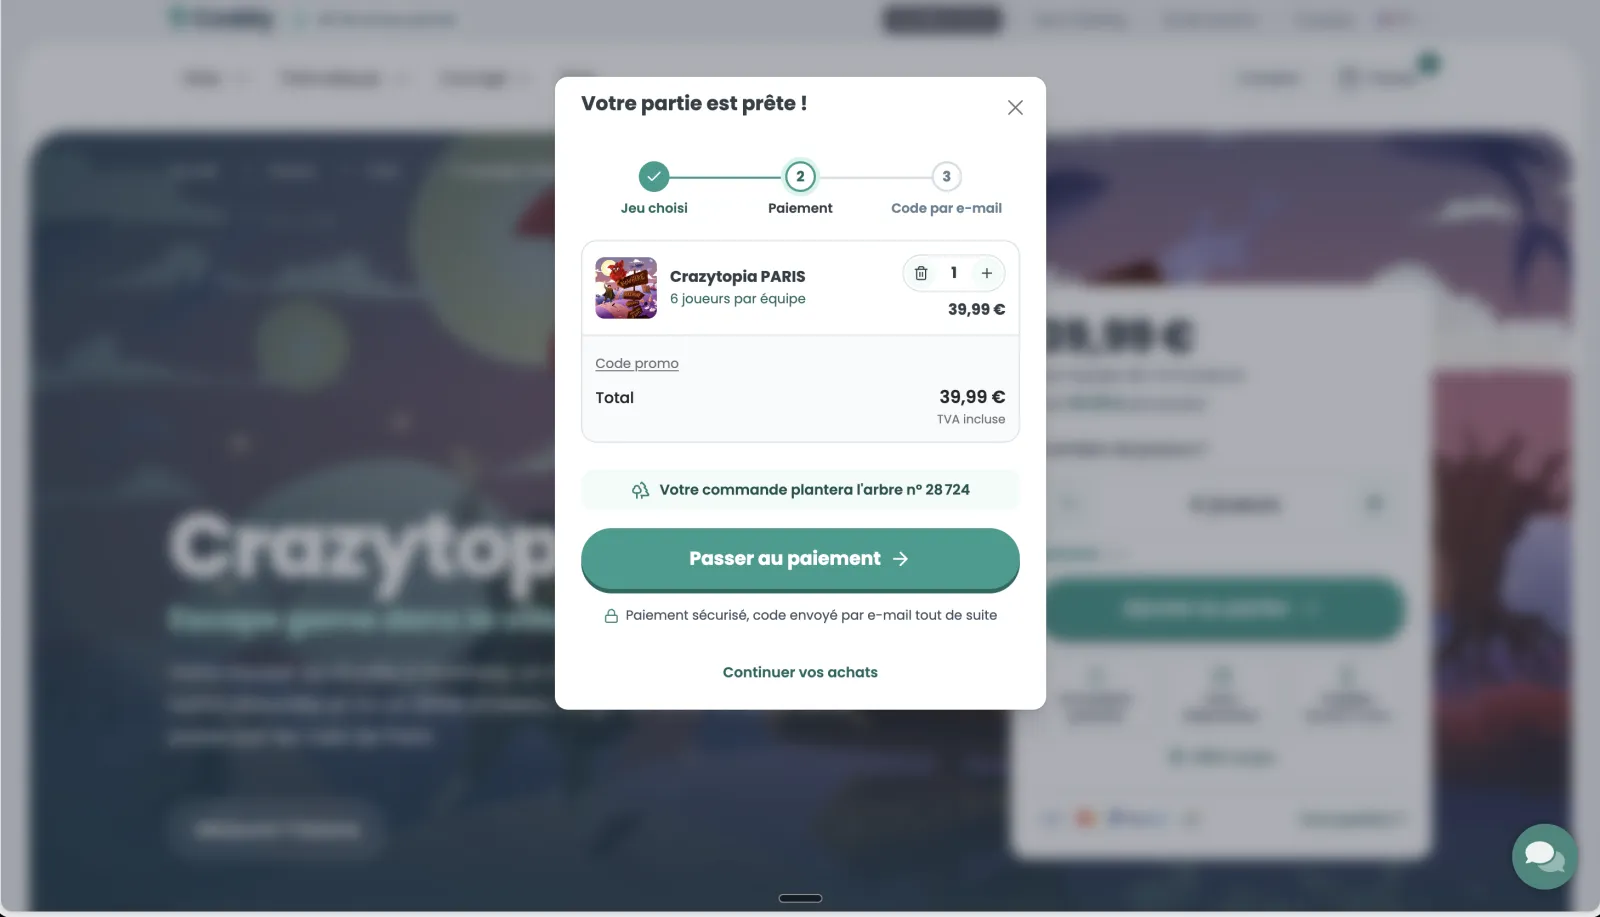
Before, the customer added a game to the basket and a modal opened. They then had to click a small button to reach an order summary, and only after that could they pay.
Now, adding a game to the basket opens the summary modal, and a large button takes the customer straight to Stripe payment. That saves two clicks.
The figures for September and October
To measure the effect of the redesign, I compared 1 September to 27 October with the same period in 2025. Payments come from Stripe (online shop only), sessions from GA4. Some figures are confidential.
| 1 September to 27 October | 2025 | 2026 | Change |
|---|---|---|---|
| Paid bookings | 268 | 406 | +51% |
| Revenue net of refunds | € - | € - | +56% |
| Average order value | € - | € - | +3% |
| Conversion rate (payments / sessions) | 0.91% | 1.19% | +0.28 pt |
Month by month, the conversion rate went from 0.84% to 0.98% in September, and from 0.99% to 1.38% from 1 to 27 October.
Prices stayed the same, and no marketing campaign ran in either period. Average order value follows the season and drops in October in both years. GA4 records about 77% of Stripe payments, in 2025 as in 2026, so the comparison holds.
Part of the increase comes from a promo code. A €10 code replaced a little-used €20 code, and since 13 October it applies in one click. In October 2026, 27% of bookings use a promo code, against 9% in October 2025.
To isolate the redesign, I looked at the first half of October, before the one-click code, leaving out discounted payments. Year on year, conversion over that fortnight went from 0.66% to 0.95%. In the second half of the month, the whole increase comes from payments with a promo code.
Your shop gets visits but few sales?
Send me your site’s address. Within 48 working hours, you receive around ten blockers ranked by impact, each with a proposed fix.